A Music Map - Work in Progress
How single cell reads a sparse matrix
A single-cell experiment hands you a matrix of cells by genes, where the entry is how many transcripts of a gene were captured in a cell. It is sparse, mostly zeros, and the zeros are unreliable: a gene reading zero is usually undetected rather than off, the dropout that comes from capturing a few thousand of a cell's hundreds of thousands of mRNAs. Two technical variables dominate before any biology shows up. Sequencing depth sets how many genes a cell detects at all, so a deeply sequenced cell looks similar to every other deep cell. Per-gene detection rate sets a gene's mean, so ubiquitous housekeeping genes swamp raw distances.
The field converged on a fixed pipeline to strip those out. Normalize and variance-stabilize first, either by library-size scaling and log, or by modeling each gene's counts as a function of cellular depth and keeping the Pearson residuals, the (observed − expected)/sqrt(expected) of a regularized negative-binomial fit (Hafemeister and Satija, 2019)1, later given a closed form (Lause, Berens and Kobak, 2021)2. Then reduce dimensions, PCA on the residuals, and build a k-nearest-neighbor graph in that low-rank space, which is where Leiden clustering and UMAP actually run. The embedding does the denoising; the rank-deficient noise floor, where a coincidence between two rare genes lives, gets thrown away before neighbors are computed. The single-cell ATAC variant makes the parallel cleaner still, because its cells-by-peaks matrix is genuinely binary (Cusanovich et al., 2015)3, and the standard move there is TF-IDF weighting followed by SVD, which is latent semantic indexing (Cusanovich et al., 2018)4. Only when the deliverable is a tested gene-gene network does the field reach for an explicit per-pair model that accounts for sampling noise, like CS-CORE (Su et al., 2023)5.
The same matrix, for music
I wanted a song recommender that ignores audio and asks only what co-listeners group together. Stack a million real playlists from the Spotify Million Playlist Dataset (Chen et al., 2018)6 into a matrix of playlists by songs, a 1 where a song sits in a playlist. Rotate it ninety degrees and it is a single-cell matrix, with every pathology in the same place.
Playlists are cells, songs are genes. The binary entry is detection.
Popularity is detection rate. A song's column sum is how often it is seen, exactly like a gene's mean. Raw co-occurrence rewards ubiquity the way raw counts reward housekeeping genes.
Playlist length is sequencing depth. A 300-track playlist co-occurs with everything, the way a deep cell detects every gene. This is the variable sctransform regresses out.
A zero is censored, not negative. A song missing from a playlist is not a vote against it, the same way a gene reading zero is not "off."
So the same operations apply. My similarity score is cosine co-occurrence, C(X,Y)/sqrt(N(X)·N(Y)), which normalizes by both songs' popularity the way TF-IDF down-weights ubiquitous peaks. Genres fall out of an SVD of the co-occurrence matrix followed by k-means, the music version of LSI plus clustering, recovering hip-hop, country, regional Mexican, and K-pop without supervision. The interactive map below lays 695,000 songs out from this embedding.
Do same-group items actually cluster
Pooled CRISPR screens run a quality check worth borrowing. Multiple guides target each gene, so if the screen worked, guides hitting one gene should track together more than random guide pairs do, and the same idea appears as a neighborhood or kNN-density test asking whether same-group items fall in each other's nearest neighbors above chance. It is a within-group versus across-group contrast, and it is the same question as "are two songs by one artist more co-listened than two random songs."
I ran it on both sides. For CRISPR I used the genome-scale Perturb-seq of Replogle et al. (2022)7, specifically the K562 essential pseudobulk, 2,285 perturbations by 8,563 genes, grouping perturbations by shared CORUM protein complex (the tractable analog of "same gene," since the single-cell guide-level matrix is 66 GB). For music I grouped songs by artist on a 100,000-playlist subset.
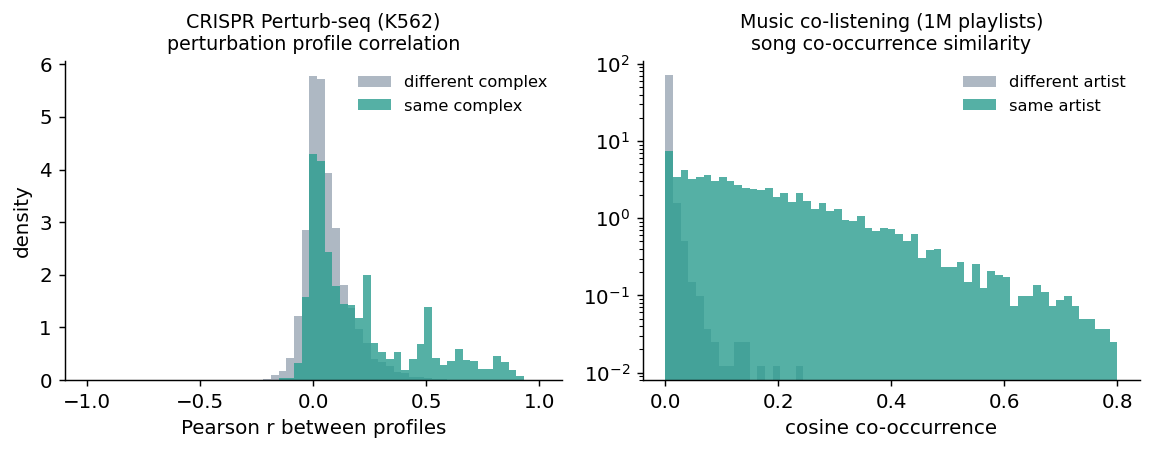
Figure 1. Same-group pairs sit far to the right of different-group pairs in both domains. CRISPR: same-complex perturbation profiles correlate at mean r = 0.21 versus 0.06 for different complexes (a random same-complex pair beats a random different pair 68% of the time). Music: same-artist song pairs reach mean cosine 0.17 versus 0.001 across artists, with the across-artist median sitting at exactly zero (AUC 0.95). The music gap is larger because authorship is a tighter grouping than complex membership.
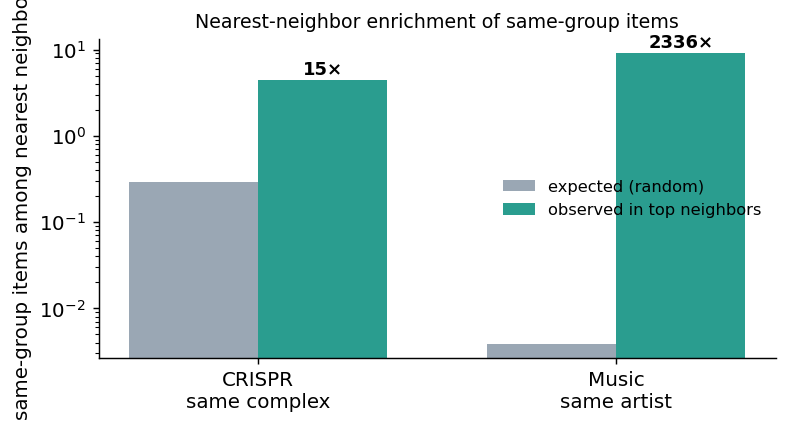
Figure 2. The kNN-density version. A perturbation's 15 nearest neighbors hold ~4.4 same-complex perturbations against 0.29 expected by chance, a 15-fold enrichment. A song's 20 nearest neighbors hold ~9 same-artist songs against 0.004 expected, a ~2,300-fold enrichment. Genes cluster by function about as cleanly as guides cluster by target; songs cluster by artist far more tightly still.
Same person, two names. Same phenotype, two genes.
The clustering result sets up a sharper question. If an artist's songs are this tight, two different artist names with nearly interchangeable playlist footprints might be one act, and if a complex's perturbations are this tight, two genes with nearly identical knockdown profiles might be one function. I ranked the most similar distinct-name (or distinct-gene) pairs in each.
The music hits are mostly not aliases. They are soundtrack cast-mates (Renée Elise Goldsberry and Phillipa Soo from Hamilton, cosine 0.72) and tight scene-mates (Luke Bryan and Florida Georgia Line), which share an album or a scene rather than an identity. A few are near-aliases of one organization (Hillsong United and Hillsong Worship, 0.68). And the method does catch a genuine same-act-two-names case, Ariel Camacho y Los Plebes Del Rancho and Los Plebes del Rancho de Ariel Camacho, the band's naming before and after Camacho's death.
The CRISPR hits are cleaner, because obligate partners are functionally indistinguishable:
| Gene pair | profile r | relationship |
|---|---|---|
| PHB / PHB2 | 0.96 | obligate prohibitin heterodimer |
| RPL23 / RPL31 | 0.94 | large ribosomal subunit |
| EIF2B2 / EIF2B5 | 0.93 | eIF2B translation-initiation complex |
| MED30 / MED7 | 0.93 | Mediator complex |
Both domains hit the same confound, the one pooled screens already know. Two super-correlated items can be the same thing (a true alias, an obligate partner) or merely share a pathway, a scene, or an off-target. You separate the cases the same way in both: a true alias or twin shows one footprint that is nearly a subset of the other, or a clean temporal succession, where cast-mates and pathway-mates stay symmetric. The similarity flags the candidate. It does not adjudicate identity.
Caveats
The CRISPR analysis is at complex resolution on pseudobulk, since the guide-level single-cell matrix that would give true same-gene reproducibility is 66 GB; Replogle et al. report that reproducibility directly. The music numbers come from a 100,000-playlist subset rather than the full million. And lift, the third score in the map, misbehaves on rare pairs the way an uncorrected hypergeometric p-value does, so the honest version gates edges by significance with multiple-testing correction and ranks the survivors by effect size. For the strongly co-listened pairs that fill any recommendation, cosine and significance nearly agree; they diverge only at the sparse tail, which is exactly where the gate earns its keep.
References
- Hafemeister, C., and Satija, R. (2019). Normalization and variance stabilization of single-cell RNA-seq data using regularized negative binomial regression. Genome Biology 20, 296. ↩
- Lause, J., Berens, P., and Kobak, D. (2021). Analytic Pearson residuals for normalization of single-cell RNA-seq UMI data. Genome Biology 22, 258. ↩
- Cusanovich, D. A., Daza, R., Adey, A., Pliner, H. A., Christiansen, L., Gunderson, K. L., Steemers, F. J., Trapnell, C., and Shendure, J. (2015). Multiplex single-cell profiling of chromatin accessibility by combinatorial cellular indexing. Science 348, 910–914. ↩
- Cusanovich, D. A., Hill, A. J., Aghamirzaie, D., et al. (2018). A Single-Cell Atlas of In Vivo Mammalian Chromatin Accessibility. Cell 174, 1309–1324. ↩
- Su, C., Xu, Z., Shan, X., Cai, B., Zhao, H., and Zhang, J. (2023). Cell-type-specific co-expression inference from single cell RNA-sequencing data (CS-CORE). Nature Communications 14, 4846. ↩
- Chen, C.-W., Lamere, P., Schedl, M., and Zamani, H. (2018). Recsys Challenge 2018: Automatic Music Playlist Continuation. Proceedings of the 12th ACM Conference on Recommender Systems. ↩
- Replogle, J. M., Saunders, R. A., Pogson, A. N., et al. (2022). Mapping information-rich genotype-phenotype landscapes with genome-scale Perturb-seq. Cell 185, 2559–2575. ↩